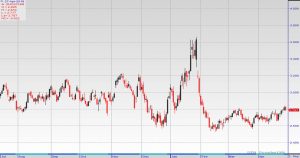
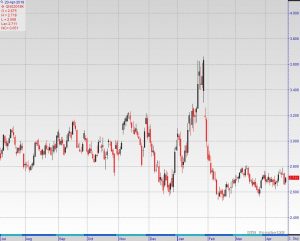
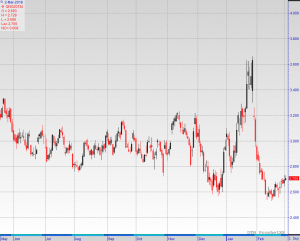
Taking the lead from the May gas contract that rolled off the board in the prior session with a 3.5-cent gain at a finish at $2.821/MMBtu, NYMEX June natural gas futures had a weak showing overnight ahead of the Friday, April 27, open, as the market looked beyond significantly depleted inventories toward what is expected to be a healthy pace of storage rebuilding going forward. At 10:05 a.m. ET the contract was 5.1 cents lower at $2.788/MMBtu.
Natural gas inventories continued to draw lower three weeks beyond the typical start of injection season, with the latest storage data from the U.S. Energy Information Administration outlining an 18-Bcf withdrawal for the week ended April 20. That bested the full range of estimates coming into the day, and defied both the 71-Bcf prior-year injection and the 60-Bcf five-year average build. Total working gas stocks were left at 1,281 Bcf, or 897 Bcf below the year-ago level and 527 Bcf below the five-year average of 1,808 Bcf.
Increased heating demand relative to historical averages is seen to have allowed for the continued storage erosion in the recent inventory report week, but milder to warmer weather of late and in store associated with subdued demand suggests the possibility of the changeover from weekly stock draws to injections.
Warmer weather west of the Rocky Mountains and near-normal conditions on the eastern seaboard contributed to a 14% week-on-week decline in residential/commercial-sector demand during the week ended April 25 that combined with a 2% decline in both power burn and industrial-sector demand to drive a 6% reduction in total U.S. gas consumption, according to the EIA’s latest “Natural Gas Weekly Update.” Dry production was up 1% week over week.
Deflated demand combined with elevated production should allow for natural gas to flow more freely into underground storage facilities.
Weather forecasts are mixed, but the prevalence of milder to warmer weather alongside the higher low temperatures associated with below-average temperatures this time of year suggest diminished weather-related demand support as heating demand drops and significant cooling load is kept at bay.
The National Weather Service sees average to above-average temperatures encompassing a majority of the country through both the upcoming six- to 10-day and eight- to 14-day periods, as below-average temperatures settle over a narrow band of the west-central U.S. in the shorter-range view and over a large area of the central into eastern U.S. in the extended view.
Growing production implied by a rising rig count is expected to help natural gas inventories build by what is expected by the EIA to be the second largest volume of refill season net stock additions on record totaling about 2,416 Bcf, or 11.3 Bcf/d, by the traditional end of the injection season Oct. 31. The agency anticipates an end-of-October storage of 3,767 Bcf.
Archive for the ‘Energy’ Category
04/27/2018: June Natural Gas Slips
April 27th, 20184-26-2018
April 27th, 2018The U.S. Energy Information Administration reported Thursday that domestic supplies of natural gas fell by 18 billion cubic feet for the week ended April 20. Analysts surveyed by S&P Global Platts had forecast a decrease of 12 billion cubic feet but on average over the last five years for the same week, inventories climbed by 60 billion cubic feet. Total stocks now stand at 1.281 trillion cubic feet, down 897 billion cubic feet from a year ago, and 527 billion below the five-year average, the government said.
The forecast for overall natural gas demand next week moves into the “moderate” range as cooler, stormier weather moves into the Midwest. Cooler temperatures and showers head into the Northeast as well late this week. Next week sees warmer temperatures across most of the country.
Total U.S. stockpiles fell week over week to 41.2% below last year’s level and are now 29.1% below the five-year average.
https://247wallst.com/energy-economy/2018/04/26/natural-gas-price-rises-following-storage-report/
But wait, there’s more!
- A pattern change will begin to develop across the central and eastern U.S. this weekend.
- Highs in the 70s and 80s are expected in the Midwest and Northeast as May begins.
https://weather.com/forecast/national/news/2018-04-26-spring-warmup-early-may-midwest-northeast
Market Commentary 4-20-2018
April 20th, 2018
Currently, the prompt month natural gas contract is trading at $2.71, up 5 cents.
Yesterday, the Natural gas market initially tried to rally towards the $2.78 level but found enough resistance in that general vicinity to turn around.
The $2.80 level is the major level that people are paying attention to, as it has been resistive in the past. It then cratered during the trading session,
breaking down to the $2.68 level. The EIA released a bullish inventory number though, so it did cause a significant bounce.
However, we are starting to roll over again, and it is only a matter of time before we reach a lower level. The $2.60 level has massive support underneath that should be a target.
The fact that we had such a bullish candle and then started to roll over again after the inventory number tells the market that there is still plenty of selling pressure.
This market will continue to be a “sell the rallies” situation, as the oversupply of natural gas continues to be an issue. Granted, the draw from inventory was higher than anticipated,
but we are getting towards the warmer for the year in North America, and that will put a massive amount of demand destruction for the market to think about into play.
A breakdown below the $2.60 level opens the door to the $2.50 level.
04/16/2018: May gas futures bolstered by extended withdrawal season
April 17th, 2018After climbing by 4.9 cents to settle at $2.735/MMBtu ahead of the weekend, NYMEX May natural gas futures derived additional support overnight leading to the Monday, April 16, open, from the recent and anticipated continuation of storage erosion beyond the traditional start to the refill season April 1. At 9:20 a.m. ET the contract was 2.0 cents higher at $2.755/MMBtu.
For only the fourth time since 2010, natural gas withdrawals on a national level were reported in April, as the U.S. Energy Information Administration detailed a 19-Bcf drawdown from stocks in its latest storage data for the week ended April 6 that defied the five-year average and year-ago injections of 9 Bcf each. It left overall inventories at 1,335 Bcf, or 725 Bcf below the prior-year level and or 375 Bcf below the five-year average of 1,710 Bcf.
Weather during the storage report week is seen to have bolstered heating demand relative to historical averages.
Varied but ultimately supportive weather was observed in the subsequent days, fueling expectations for another atypical pull from stocks in the low 20s Bcf when the next inventory data that will cover the week to April 13 is released on Thursday, April 19.
Heat in the Pacific and southern regions combined with cold in the northern regions to drive both heating and cooling demand during the week ended April 11, much of which will be reflected in the upcoming storage report period. A 4% week-on-week gain in power burn and a 14% increase in residential/commercial-sector demand contributed to a 7% uptick in total U.S. gas consumption during the week in review, according to the EIA’s latest “Natural Gas Weekly Update.”
Weather conditions moderate in the coming weeks and months, however, likely keeping demand subdued and limiting upside momentum for futures.
Revised National Weather Service forecasts show below-average temperatures encompassing the fringes of the West and nearly the entire eastern two-thirds of the U.S. in the six- to 10-day period, but shrinking in scope to be contained to much of the mid-Atlantic, the lower tier of the Midwest and most of the South in the eight- to 14-day period.
Average to above-average temperatures initially confined to Florida, a few patches of the central U.S. and a majority of the West will eventually overtake the Northeast, the balance of the mid-Atlantic, much of the Midwest and more areas of the South.
Further out, forecasters point to warmer-than-normal weather over a large part of the U.S. from April through June.
Weather as projected will likely erase lingering natural gas demand for heating ahead of the onset of significant cooling load associated with the summer heat, facilitating the onset of the injection season as natural gas is allowed to flow more freely into underground storage facilities.
A rising rig count portending production growth feeds the possibility of a healthy pace of storage rebuilding in store. The latest Baker Hughes data show an increase of five rigs in the U.S. total rig count for the week to April 13 to 1,008 rigs.
The EIA sees natural gas inventories climbing to 3,767 Bcf by the traditional end of injection season Oct. 31, with injections totaling about 2,416 Bcf, or 11.3 Bcf/d, the second largest volume of refill season net injections on record.
PRELIMINARY Seasonal Assessment of Resource Adequacy for the ERCOT Region (SARA) Summer 2018
April 12th, 2018SUMMARY ERCOT is predicting record-breaking peak usage this summer season (June – September 2018). The strong Texas economy continues to drive demand in the ERCOT Region, and the anticipated peak demand is expected to be more than 1,600 MW higher than the all-time peak demand record of 71,110 MW set in August 2016.
This anticipated record demand, combined with recent plant retirements and delaysin some planned resources, is expected to result in tight reserves that could trigger the need for ERCOT to deploy such resources as Ancillary Services and contracted Emergency Response Service capacity to maintain sufficient operating reserve levels. ERCOT may also request that Transmission and/or Distribution Service Providers (TDSPs) implement load control measures established through Standard Offer contracts with their customers. Based on the December 2017 Capacity, Demand and Reserves Report, there is approximately 2,300 MW of such additional capacity available to ERCOT for addressing reserve deficiency situations. ERCOT also anticipates further voluntary load reductions and an increase in power sold in the market by industrial facilities in response to higher power prices during peak demand.
This preliminary report includes a 72,974 MW summer peak load forecast based on normal weather for years 2002-2016 and an adjustment reflecting additional load from the Freeport Liquefied Natural Gas project that is currently under construction*. For this SARA report, the forecast was lowered by 218 MW due to a recently announced delay in the operations date for the first production unit of the LNG project. The total resource capacity available for the upcoming summer is 77,658 MW.
Planned capacity additions expected to be in service before the start of the summer season include 130 MW of gas-fired generation (based on summer ratings), 660 MW of wind with a summer peak capacity contribution of 92 MW, and 387 MW of solar with a summer peak capacity contribution of 291 MW.
The resource adequacy scenarios for this report include a unit outage forecast of 4,349 MW based on average seasonal historical outages for the last three summer seasons. ERCOT also includes a scenario combining the peak load forecast with an extremely low wind output of 798 MW.
http://www.ercot.com/content/wcm/lists/143010/2018_LongTerm_Hourly_Peak_Demand_and_Energy_Forecast_Final.pdf
02/26/2018: March Natural Gas Futures Tick Higher
February 26th, 2018NYMEX March natural gas futures rose in short covering overnight leading to the Monday, Feb. 26, open and the contract’s roll off the board at the close of business. At 6:50 a.m. ET (1150 GMT) the contract was 4.7 cents higher at $2.672/MMBtu but by 10:25am ET the contract actually traded lower by 1.5 cents at $2.61.
Although forecasts show average to below-average temperatures expanding in scope across the central and eastern U.S., moderate conditions associated with the calendar suggests limited weather-related demand support.
Updated National Weather Service outlooks show below-average temperatures encompassing nearly the entire West, fringes of the Midwest and a small patch of the Southeast in the six- to 10-day period, before shifting in scope to settle over less but still a majority of the West, slightly more of the Midwest, the lower tier of the mid-Atlantic, all of the Southeast and about half of the Gulf Coast in the eight- to 14-day period.
Average temperatures initially contained to a band along the west-central U.S. and the lower half of the mid-Atlantic into parts of the Southeast eventually scatter to hold over the edges of the Northeast, balance of the mid-Atlantic, much of the Midwest, parts of the Gulf Coast and a few areas of the Southwest. Above-average temperatures dominant in the central and eastern U.S. in the shorter-range view become confined to portions of the Northeast, Michigan, Texas and southern Rockies further out.
“It is the end of the winter heating season and normal to even below normal temperatures this time of the year are not as supportive as they would be in the heart of the season,” Energy Management Institute principal Dominick Chirichella said in a Feb. 23 note to clients.
Should weather implied by the calendar keep demand deflated, the pace of storage erosion will likely remain subdued moving closer to the end of the traditional withdrawal season on March 31.
Lackluster weather-related demand is already seen to have slowed down the rate of storage withdrawals from the 194-Bcf draw in the week ended Feb. 9 to the 124-Bcf pull in the most recent inventory report week ended Feb. 16.
While the latest reported storage drawdown was on the high end of the range of estimates coming into the day and above the 92-Bcf year-ago pull, it was below the closely watched 145-Bcf five-year-average draw. It left total working gas stocks at 1,760 Bcf, or 609 Bcf below the prior-year level and 412 Bcf below the five-year average of 2,172 Bcf.
Another modest storage draw could be in store when the next inventory report that will cover the week to Feb. 23 is released, as the EIA’s latest “Natural Gas Weekly Update” shows warmer weather in the eastern U.S. that drove down natural gas demand in the residential/commercial sector, contributing to a 14% week-on-week decline in total U.S. gas consumption during the week to Feb. 21.
An ongoing slowdown in the rate of weekly stock draws should allow for more natural gas to remain in underground storage than previously expected. Assuming net storage draws matching the five-year average for the balance of the withdrawal season, the EIA sees total natural gas inventories reaching 1,290 Bcf on March 31, which is 24% lower than the five-year average and the second lowest end-of-season level reported since 2010.
2016 Brings Pessimism to Oil and Gas
January 6th, 2016As 2016 begins, the energy industry remains uncertain of when the oil and gas sector will turn around — and companies are taking steps to streamline operations until prices begin to recover.
That is according to BDO USA, whose annual survey found that 85 percent of U.S. oil and gas chief financial officers (CFO) are predicting low oil and gas prices to be their greatest financial challenge in 2016 — and many energy companies are looking to tighten their belts by selling off assets.
The survey also found that 75 percent of energy CFOs expect M&A activity to rise in the coming year — up from 56 percent last year. Though activity was slower than expected in 2015, deal pace has already started to pick up, with industry giants like Schlumberger and Shell acquiring smaller rivals who have been struggling in this tumultuous pricing environment. Not surprisingly, just under half (49 percent) of CFOs believe undervalued oil and gas assets will be the primary driver of transactions as larger companies and investors home in on struggling companies seeking to shed distressed properties and business units.
The energy sector’s increased pessimism about their ability to access capital and credit may also catalyze deal activity in the months to come. The percentage of CFOs who feel worse about their company’s access to capital has more than doubled — from just 20 percent in 2015 to 45 percent this year. During October 2015’s debt redetermination period, many heavily-indebted exploration and production companies saw reductions in their borrowing bases, which has already produced operational impacts: 45 percent of CFOs experiencing project delays or terminations over the past year cite lack of capital as a leading cause.
“Throughout 2015, we saw many M&A players hesitant to engage in deal activity, likely because sellers hoped the bust cycle would balance out throughout the year and drive valuations up,” said Charles Dewhurst, leader of the Natural Resources practice at BDO. “However, as we enter the New Year, they are letting go of the idea of rapid recovery and may look to sell before valuations bottom out further.”
With debt financing becoming increasingly challenging for energy companies, many are increasing their reliance on private equity to keep afloat. Fifty-five percent of CFOs surveyed say they are likely to utilize private equity as a source of outside capital in the coming year — up from 50 percent last year and 40 percent in 2014.
CFOs are rethinking expenditures and planning to be more conservative in funding new investments as commodities prices continue to hover near record lows. Despite the Obama administration’s decision to permit offshore drilling in the Arctic and Atlantic last year, only 1 percent of CFOs say they will be increasing capital investment in offshore exploration — down from 23 percent in 2015. Meanwhile, the number of CFOs planning to increase investment in non-conventional plays dropped from 47 percent last year to approximately one in three CFOs this year.
In addition to cutting back on investments, oil and gas companies are making tough decisions as contracting prices force them to scrutinize their labor costs. Seventy-one percent of CFOs hope to keep staffing levels consistent with last year, while 9 percent of CFOs say they are likely to reduce their labor force in order to increase profitability, up from 1 percent last year. Those employees who do survive the cuts are likely to personally feel the impact of tightening budgets: Fifty-seven percent of CFOs expect employee bonuses to be smaller for fiscal year 2015.
“Executives must balance the need to bring costs down with the very real risk that a large reduction in labor force may catch them on the back foot when prices begin to climb again,” said Jim Willis, senior director of compensation consulting in the Global Employer Services group and a member of BDO’s Natural Resources practice. “The industry is threading this needle for now by effectively implementing a hiring freeze, but if prices remain low for much longer, more companies may need to seriously evaluate reducing their headcount.”
While commodity price volatility remains front and center, focus on environmental regulation wanes. Given the state of the industry, it’s unsurprising that concerns about environmental compliance risks have lessened considerably, with about one in five CFOs citing it as the primary area of focus for their risk reduction activities compared to 61 percent a year ago. Investments in environmentally friendly exploration and production technologies have also grown less feasible for many companies: Just 22 percent of CFOs plan to increase their investment in this area, down from 35 percent in 2015.
06/04 10:33a CST DJ Natural Gas Rebounds Despite Data Showing Second-Largest Surplus on Record
June 4th, 2015Natural gas prices dipped, but then rebounded into gains for the day after
federal data showed last week produced the second-highest weekly surplus on
record.
Analysts and a trader said the market may have bounced from hitting its
one-month intraday low of $2.557 a million British thermal units. The
front-month July contract recently rebounded all the way to gains of 1 cent, or
0.4%, at $2.644/mmBtu on the New York Mercantile Exchange.
The market has been overwhelmed by bearish traders for months, and the
crowded trade itself has sparked some brief rallies. When a bearish trade gets
crowded, waves of traders often close out at once all trying to protect
themselves against a reversal at seemingly marginal signs of a rebound. That
doesn’t mean the market is fundamentally different, analysts and a trader said.
“We’re just respecting an old low,” said Dean Hazelcorn, trader at the
brokerage Coquest Inc. in Dallas. “People are not reloading their guns to get
long.”
Data released Thursday suggests the market is oversupplied by about 3 bcf a
day last week, according to analysts’ estimates. The U.S. Energy Information
Administration said storage levels grew by 132 billion cubic feet in the week
ended May 15. That is more than 40% larger than the 92-bcf five-year average
addition for the week and also more than the 123-bcf median average from
forecasters surveyed by The Wall Street Journal.
The EIA update is widely considered one of the best measures of supply and
demand for the natural-gas market. Gas prices have been too high to convince
power plants to use more of it and absorb near-record supplies, and Memorial
Day also probably cut demand by keeping businesses and schools closed, analysts
said.
“The market was ready for a large injection, but it’s still extremely
bearish,” said Kent Bayazitoglu, analyst at Gelber & Associates. “We’re not
going to see (a) strong rebound.”
Last week’s addition brought storage levels to 2.2 trillion cubic feet, 51%
more than a year ago and 1% above the five-year average.
February 25th, 2015
02/25/2015 07:45
After finishing a relatively quiet day of trade with a modest 2.3-cent gain
at $2.902/MMBtu, March natural gas futures continued in quiet trade overnight
ahead of the Wednesday, Feb. 25, trading session, with the contract’s
expiration at the close. While moving shallowly on either side of the prior
day’s settle in a $2.887/MMBtu to $2.930/MMBtu spread, the front-month was last
eyed stalled at $2.94/MMBtu, up 4 cents.
Short-covering allowed the contract its modest upside in the prior session
as traders worked to cover positions ahead of the contract’s roll off the
board, with ample amounts of cold weather in forecasts to drive some gains.
However, weather forecasts for the upcoming six- to 10-day period have been
largely unchanged and the market is running out of steam off of the outlooks
that show below-average temperatures dominating the majority of the country. A
swath of average temperatures will span from the Southeast into a portion of
the Gulf, while another area of average temperatures will span along the coast
of California. Above-average temperatures will be confined to portions of the
Southeast and Gulf.
Further, in the eight- to 14-day projection, while below-average
temperatures continue to dominate, the intensity of the cold is diminished
across the bulk of the country. While a similar area in the Southeast and Gulf
will see average and below-average temperatures, the area of average
temperatures expands in the West to encompass areas of the Northwest and
Southwest in addition to California. Meanwhile, the California coastal areas
will see above-average temperatures.
Taking note of the time of year, as winter continues its end-run and spring
gets set to sprint, the market anticipates little threat to the natural gas
supply, and with a healthy end-of-season inventory on tap, continues to find
only modest support for small bursts of short-covering, but no real support for
a sustainable move back above $3/MMBtu.
The market is nonetheless poised for the midmorning release Thursday, Feb.
26, of U.S. Energy Information Administration storage data that will cover the
week to Feb. 20, when cold weather blanketed major heat-consuming portions of
the country, unleashing demand.
As a result of the cold that generated 53.7% more heating degree days than
last year and 40.2% more than normal, according to National Oceanic and
Atmospheric Administration data, natural gas storage withdrawals are expected
to ramp-up beginning with this week’s inventory report and possibly extending
into the following week.
Market participants are expecting pulls ranged from 237 Bcf to 257 Bcf with
consensus formed near a 247-Bcf withdrawal.
The pull will compare bullish against a 131-Bcf five-year average draw and
the 117-Bcf pull reported for the corresponding week in 2014. At consensus, the
draw would bring natural gas inventories to 1,910 Bcf, reversing the
year-on-five-year-average storage surplus of 58 Bcf left after the 111-Bcf
withdrawal reported by the EIA for the week to Feb. 13, to a deficit of 58 Bcf.
The data has the potential to move March futures higher in its final day on
the board and could keep support under the soon-to-be lead April contract, with
its bullish comparisons and the implication of a tightening supply/demand
balance.
“So far the market has been quite tolerant, even complacent regarding both
the current cold snap itself and its likely impact on storage levels, but we
continue to see potential for a short covering rally to $3.20 or more over the
next few weeks,” Citi Futures analyst Tim Evans said.
Still, natural gas inventories currently stand at 2,157 Bcf, 678 Bcf above
the year-ago level, and are on track to end the season well above the 822 Bcf
left in storage at the end of 2013-2014 winter heating season.
With eyes shifting to April futures, the contract closed out the prior
session down 0.4 cent at $2.889/MMBtu and extended losses overnight. Finding a
$2.866/MMBtu to $2.911/MMBtu range, the contract was last down 1.2 cents at
$2.877/MMBtu.
In spot trade, cold weather lost its impact on the markets as slight trends
toward warming will equate to lower demand.
January 2015 Gas Tumbles as Inventories Remain on Track
December 23rd, 2014
Following a sharp 17.8-cent decline ahead of the weekend to a settle at
$3.464/MMBtu, January 2015 natural gas futures continued to unwind overnight
ahead of the Monday, Dec. 22, open, as the anticipation of a healthy
end-of-season storage level continued to weigh on values, despite colder
weather forecasts suggesting stronger demand and an increased pace of storage
erosion. Sending the entire overnight session in negative territory, the
contract moved from $3.45/MMBtu to $3.12/MMBtu and was last down an
impressive 33 cents to $3.12/MMBtu, a level not seen since August 2013.
According to the National Weather Service, below-average temperatures will
dominate the bulk of the country in the upcoming six- to 10-day period to
encompass most of the West, the whole central U.S. and much of the East, from a
majority of the Mid-Atlantic on to the Southeast. Average temperatures are
expected to linger over a few parts of the Southwest, Northeast and
Mid-Atlantic, while above-average temperatures are forecast to be confined to
about two-thirds of the Northeast and portions of the Pacific.
Below-average temperatures are seen spreading to engulf more of the East
further out to the eight- to 14-day period, as above-average temperatures
shrink in scope to be contained over parts of the Pacific. Average temperatures
are called only for Maine, southern Florida and a narrow stretch of the
Southwest.
While widespread below-average temperatures in forecasts are expected to
generate increased demand for heating that would heighten the rate of weekly
storage withdrawals going forward, relatively milder conditions than last year
and ongoing robust production should help keep the pace of storage erosion
lackluster compared to historical averages.
“More moderate temperatures in 2014 are supporting the decrease in
consumption; heating degree days since the start of November have been 7.2%
lower in 2014 compared to 2013,” the U.S. Energy Information Administration
said in its latest “Natural Gas Weekly Update.” Consumption of natural gas
since Nov. 1 has averaged 78.1 Bcf/d, down from 83.0 Bcf/d during the
corresponding period last year.
The EIA sees natural gas consumption remaining subdued relative to the
prior-year level through the balance of the winter amid near-average
temperature outlooks this season. “However, even if the rest of the winter
matches last winter in severity, it is unlikely that storage inventories would
drop as low as they did at the end of last winter because of the gains in
production,” the agency said.
Although rig counts are falling, with the latest data from Baker Hughes
Inc. showing that total U.S. rig count dropped 18 since the week ended Dec. 12
due to a loss of 10 oil rigs and eight natural gas rigs, the count remains 107
higher than at the same time last year.
Additionally, the EIA said that in the past several weeks, natural gas
production levels have reached record highs, with dry gas output averaging 70.8
Bcf/d since Nov. 1, which represents an increase of 4.8 Bcf/d over the same
period in 2013.
The EIA calls for an end-of-March 2015 natural gas inventory of 1,431 Bcf,
significantly higher than the 2014 end-of-March storage levels, which were at
an 11-year low of 857 Bcf, according to agency data. Working natural gas in
storage has already surpassed the year-ago level, after a 64-Bcf withdrawal
reported for the week to Dec. 12 took inventories to 3,295 Bcf, generating a
6-Bcf surplus to the prior-year figure which was impacted by frigid cold that
prompted a surge in demand and sharp reduction in the natural gas supply.
Compared to the five-year average of 3,553 Bcf, a 258-Bcf deficit remains.


