Archive for the ‘Energy’ Category

Natural Gas Price Fundamental Daily Forecast – Rising Production, Diminished Heat Pressuring Prices

July 10th, 2018

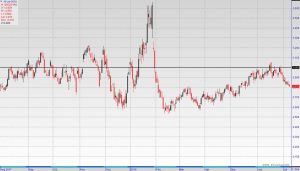
Technically, the main trend is down according to the daily swing chart. The downtrend was reaffirmed when sellers took out the previous main bottom at $2.821. If this continues to generate impressive downside momentum then look for a possible extension of the selling into the next major bottom at $2.727.


Natural gas futures are trading lower early Tuesday. Although there is heat in the forecasts, it’s not impressive enough to stop the current price slide. It’s also not enough to offset rising production that is raising hope that the supply deficit may be filled by the start of winter.

At 0944 GMT, August Natural Gas is trading $2.806, down $0.022 or -0.78%.

NatGasWeather supports the notion that that recent guidance has failed to offer enough heat in the Northeast for the second half of July.

“It’s still a hot overall U.S. pattern with upper high pressure dominating large stretches of the country, just not impressively so with the Great Lakes and Northeast only experiencing bouts of heat, but not sustained,” the firm said. “The latest midday data maintained a weather system arriving into the northeastern U.S. Thursday and Friday, cooling hot early week conditions.”

“Although, upper high pressure is expected to spring back across the U.S. this weekend for a swing back to stronger demand as most of the country returns to highs of upper 80s to 100s,” NatGasWeather said. “But where the data still isn’t hot enough is across the Midwest and Northeast during the middle and end of next week as weather systems with showers and cooling ride around the northern periphery of the hot ridge.”

Technically, the main trend is down according to the daily swing chart. The downtrend was reaffirmed when sellers took out the previous main bottom at $2.821. If this continues to generate impressive downside momentum then look for a possible extension of the selling into the next major bottom at $2.727.

The main range is $2.727 to $3.043. Its 50% to 61.8% retracement zone at $2.885 to $2.848 is new resistance. Unless the heat dome returns, spreads across the country and production falls, buyers are going to have a hard time recovering this zone. Even if they did, hedgers would be waiting to refresh their positions. This may be the only reason for profit-taking or a short-covering rally.
Natural Gas Price Fundamental Daily Forecast – Trader Reaction to $2.848 Should Set Tone Today

July 9th, 2018

With the market currently sitting near a key support level, the next 10-14 day forecast could determine whether prices plunge to $2.727 or retrace back to at least $2.933 over the near-term.

Natural gas futures are trading lower early Monday. Currently, the market is trading inside the July 5 and July 6 ranges while straddling a key technical level on the daily chart. This indicates investor indecision and impending volatility.
August Natural Gas is trading $2.831, down $0.027.
The uncertainty in the market at this time is understandable because traders are waiting to see the next 10 to 14 day forecast that will offer more insight into temperatures beyond July 15. Going into the week-end, the latest forecast was calling for the return of more mild temperatures after mid-month.
Traders were also watching the daily chart pattern. According to the daily chart, the main range is the May 7 bottom at $2.727 and the June 18 top at $3.043. Inside this range is a 50% to 61.8% retracement zone at $2.885 to $2.848.
Trader reaction to $2.885 to $2.848 will determine the next major move in the market. Currently, natural gas is trading on the weak side of the 50% level at $2.885 and straddling the 61.8% level at $2.848. A sustained move under $2.848 will indicate the selling pressure is getting stronger. This could lead to a break into the May 17 main bottom at $2.821.
If $2.821 fails then look out to the downside because the next target is $2.727.
If buyers can overcome $2.885 then we could see a short-covering retracement rally into $2.933 to $2.959.
The Fundamentals
On Friday, the U.S. Energy Information Administration reported that U.S. supplies of natural gas rose by 78 billion cubic feet for the week-ended June 29. This was slightly above the estimate of 75 Bcf.
Total stocks now stand at 2.152 trillion cubic feet, down 717 Bcf from a year ago, and 493 Bcf below the five-year average, the EIA said. Last year, total stocks stood at 2.869 Tcf. The five-year average is at 2.645 Tcf.
The latest production figures show it running more than 7 Bcf/d higher year/year.
Essentially, the bulls and the bears are battling between concerns of lower than normal storage and the lingering hot weather along with complacency that current production levels will eventually overtake any shortages before the winter.

Natural Gas Futures Trim Gains After Storage Data

June 28th, 2018

This week’s EIA storage report is expected to show an injection of 70 Bcf, in line with the 5-year average. After two consecutive bearish storage reports,

this one may be the one that finally drives out the lingering long speculators. Additionally, on Friday, the EIA will release its monthly production report.

If it shows rapidly growing production then look out to the downside.


The top-step natural gas futures contract is trading higher early Wednesday for a second day as investors continued to show respect for a pair of market bottoms and a major technical support zone.

The price action may also be related to position-squaring ahead of the expiration of the July futures contract on Wednesday.

The August Natural Gas futures are trading $2.991, up $0.055.

The sideways price action this week is related to mixed weather data showing slightly cooler temperatures for the first week of July, but a generally hot temperature pattern for the June 20 to July 6 period.

Besides the ever-changing weather forecast, investors are also watching production. According to Genscape, Inc., on Monday, production volume was more than 1 Bcf/d higher than last week’s volumes and are hovering near record levels.

Based on this figure, the Mobius Risk Group is saying that an additional 1 Bcf/d of production growth from this point through the end of the storage injection season would still leave end-of-injection season storage levels at less than 3,600 Bcf, assuming flat year-on-year demand and normal temperatures.

As far as the weather is concerned, NatGasWeather.com is saying its Global Forecasting System forecasting model is predicting temperatures a little hotter for July 9-11. Overall, a bullish pattern is expected beginning late next this week into mid-July as most of the country is forecast to see temperatures warm to above-normal levels.

Forecast

The chart clearly shows higher bottoms at $2.896, $2.891 and $2.883. This in addition to a technical 50% to 61.8% support zone at $2.885 to $2.848. These levels have to hold in order to form the technical support base needed to drive the market through $3.043.

However, there is a problem and it is rising production that is offsetting any forecasts for above-average temperatures. At this point in the season, production has to plunge, or temperatures have to spike higher and stay there for a while to generate the buying strength needed to overcome $3.043.

The weather is too unpredictable to count on and production is not likely to fall unless there is a major supply disruption so we have to conclude that the next rally is likely to fall short of last week’s high at $3.043. This, combined with seasonal selling pressure makes natural gas vulnerable to the downside.

This week’s EIA storage report is expected to show an injection of 70 Bcf, in line with the 5-year average. After two consecutive bearish storage reports, this one may be the one that finally drives out the lingering long speculators.

Additionally, on Friday, the EIA will release its monthly production report. If it shows rapidly growing production then look out to the downside.

Natural Gas Price Fundamental Daily Forecast Increasing Production Makes Market Vulnerable to Seasonal Weakness

June 27th, 2018

This week’s EIA storage report is expected to show an injection of 70 Bcf, in line with the 5-year average. After two consecutive bearish storage reports,

this one may be the one that finally drives out the lingering long speculators. Additionally, on Friday, the EIA will release its monthly production report.

If it shows rapidly growing production then look out to the downside.


The top-step natural gas futures contract is trading higher early Wednesday for a second day as investors continued to show respect for a pair of market bottoms and a major technical support zone.

The price action may also be related to position-squaring ahead of the expiration of the July futures contract on Wednesday.

The August Natural Gas futures are trading $2.991, up $0.055.

The sideways price action this week is related to mixed weather data showing slightly cooler temperatures for the first week of July, but a generally hot temperature pattern for the June 20 to July 6 period.

Besides the ever-changing weather forecast, investors are also watching production. According to Genscape, Inc., on Monday, production volume was more than 1 Bcf/d higher than last week’s volumes and are hovering near record levels.

Based on this figure, the Mobius Risk Group is saying that an additional 1 Bcf/d of production growth from this point through the end of the storage injection season would still leave end-of-injection season storage levels at less than 3,600 Bcf, assuming flat year-on-year demand and normal temperatures.

As far as the weather is concerned, NatGasWeather.com is saying its Global Forecasting System forecasting model is predicting temperatures a little hotter for July 9-11. Overall, a bullish pattern is expected beginning late next this week into mid-July as most of the country is forecast to see temperatures warm to above-normal levels.

Forecast

The chart clearly shows higher bottoms at $2.896, $2.891 and $2.883. This in addition to a technical 50% to 61.8% support zone at $2.885 to $2.848. These levels have to hold in order to form the technical support base needed to drive the market through $3.043.

However, there is a problem and it is rising production that is offsetting any forecasts for above-average temperatures. At this point in the season, production has to plunge, or temperatures have to spike higher and stay there for a while to generate the buying strength needed to overcome $3.043.

The weather is too unpredictable to count on and production is not likely to fall unless there is a major supply disruption so we have to conclude that the next rally is likely to fall short of last week’s high at $3.043. This, combined with seasonal selling pressure makes natural gas vulnerable to the downside.

This week’s EIA storage report is expected to show an injection of 70 Bcf, in line with the 5-year average. After two consecutive bearish storage reports, this one may be the one that finally drives out the lingering long speculators.

Additionally, on Friday, the EIA will release its monthly production report. If it shows rapidly growing production then look out to the downside.


Natural Gas Price Fundamental Daily Forecast – Hedge Sellers in Control as Spec Buyers Await Fresh Weather Forecasts

June 25th, 2018


The key support area on the daily chart is $2.885 to $2.848. This zone also represents value so a break into this area could bring in speculative buyers. If there is going to be another rally then it’s likely to start on a test of this zone.


Natural gas futures are trading lower early Monday which means investors are pricing in milder temperatures this week than originally forecast. Traders could also be expressing concerns over rising production.

At 0717 GMT, August Natural Gas is trading $2.917, down $0.028 or -0.95%.

The current weather forecasts call for cooler temps at the start of the week in key demand areas throughout the Midwest and parts of the East then the return of heat later in the week. Therefore, overall demand is expected to be moderate to increasingly high.

Today’s early price action suggests investors want further confirmation that temperatures will heat up after July 1. This data may not be made available until Monday or Tuesday afternoon. Until then, the short-selling hedgers appear to be taking control. Any mention of renewed heat, or lingering heat during the first two weeks of July will force these shorts out of the market, and could even encourage some speculative buying.

Currently, the supply deficit is 27.4% lower than levels at this time a year ago, and about 19.9% below the five-year average for this time of year. This is why the market has been so sensitive to the weather forecasts.

Forecast

The key support area on the daily chart is $2.885 to $2.848. This zone also represents value so a break into this area could bring in speculative buyers. If there is going to be another rally then it’s likely to start on a test of this zone.

Until the new 6 – 10 day weather forecasts are released, we have to assume that prices will continue to retreat until they hit the support zone at $2.885 to $2.848. Trader reaction to this zone will set the tone for the day, and perhaps the week.


June 13th, 2018

Mixed fundamentals are pressuring natural gas futures for a second session after a forecast of hotter temperatures drove the market higher at the start of the week.

At -1000 EST, August Natural Gas futures are trading $2.966, up 0.027.

The price action in the nearby July futures contract and the next up August contract clearly shows that $3.000 is major resistance.

While most of the focus recently has been on the weather, traders can’t overlook output. Record high production levels so far this year

are one of the reasons prices have stayed below the $3 level, even with a 22% deficit in national gas stocks; the five-year average is $2.329/MMBtu.

Additionally, according to the Energy Information Administration, current working gas in underground storage sits at 1.817 Tcf for the week ended June 1.

Based on S&P Global Platts Analytics estimates, U.S. production fell 1.4 Bcf on the day to 76.8 Bcf Tuesday, largely due to production declines in the Rockies

and the Northeast. What could lead to further price pressure, or at least cap gains is expectations of a rise in production to 77.9 Bcf/d over the next seven days.


Natural Gas – 6/6/2018

June 6th, 2018

NYMEX July natural gas futures were broadly steady in early Wednesday trading, ticking up slightly after Tuesday’s fall and nearly back to the $2.90/MMBtu mark after weather-related losses over previous trading sessions.

The NYMEX July futures contract was seen trading at $2.899/MMBtu at 0700 EDT (1100 GMT), 0.9 cent higher than Tuesday’s settlement of $2.89/MMBtu.

The contract ranged between $2.887/MMBtu and $2.912/MMBtu, easing lower as the bearish sentiment continued, after the contract lost 4 cents Tuesday on the back of a mixed weather outlook.

In its latest forecast, US National Weather Service showed above-average temperatures over most of the US in its 6-10 day outlook, while below-average conditions were expected in the Northwest of the country.

Milder temperatures could drive demand further down, with total US demand falling 600 MMcf to 70.4 Bcf Tuesday.


5-17-2018 Storage Up, Gas Down

May 17th, 2018

The U.S. Energy Information Administration said in its weekly report that natural gas storage in the U.S. increased by 106 billion cubic feet in the week ended May 11, compared to forecasts for a build of 104 billion.

Thursday’s data compared with a gain of 89 billion cubic feet (bcf) in the preceding week and represented a decline of 821 billion from a year earlier and was also 501 bcf below the five-year average.

Total U.S. natural gas storage stood at 1.538 trillion cubic feet, 34.8% lower than levels at this time a year ago and also 24.6% below the five-year average for this time of year.

After the report, natural gas for delivery in June on the New York Mercantile Exchange fell 1.9 cents, or about 0.7%, to trade at $2.796 per million British thermal units by 10:33AM ET (14:33GMT).

Futures had been trading down 1.7 cents, or about 0.6%, at $2.798 prior to the release of the supply data.

The commodity was on track for its third straight session of declines, wiping out a rally of 1.3% on Monday as updated forecasting models pointed to above-average temperatures covering most of the country through the end of May.

Demand for natural gas tends to rise in the summer months as warmer temperatures increase the need for gas-fired electricity to power air conditioning.


05/10/2018: Natural Gas Storage Builds , Beats Averages

May 10th, 2018

The U.S. Energy Information Administration reported a net 89-Bcf injection into natural gas inventories in the Lower 48 during the week ended May 4 that was at par with consensus and above averages.

The injection matched consensus ahead of the report’s release that called for a 89-Bcf build to stocks, and compared above respective year-ago and five-year average injections of 49 Bcf and 75 Bcf, respectively.

The injection brought total U.S. working gas supply to 1,432 Bcf, or 863 Bcf below the year-ago level and 520 Bcf below the five-year average storage level of 1,952 Bcf.

June natural gas futures were trading higher ahead of the data’s 10:30 a.m. ET release eyed 2.2 cents higher at $2.759/MMBtu at 10:29 a.m. ET. Following the release, the contract extended past the pre-release high of $2.772/MMBtu to a fresh high at $2.792/MMBtu and traded last 4.9 cents higher at $2.786/MMBtu.

In the East, inventories were up 20 Bcf on the week at 243 Bcf, or 29.8% below the year-ago level. Storage levels in the Midwest were up 19 Bcf at 240 Bcf, or 54.1% below the year-ago level. In the Mountain region, storage levels were up 6 Bcf on the week at 92 Bcf, or 40.6% below the year-ago level, while in the Pacific region, storage levels were up 8 Bcf on the week at 195 Bcf, or 17.7% below the year-ago level. In the South Central region, where storage levels were up 36 Bcf, stocks are at a deficit of 35.9% to a year earlier.

Working gas stocks in the South Central region totaled 662 Bcf, with 204 Bcf in salt cavern facilities and with 458 Bcf in non-salt cavern facilities. Working gas stocks were up 14 Bcf in salt cavern facilities and up 22 Bcf in non-salt cavern facilities since the previous week.

Market prices and included industry data are current as of the time of publication and are subject to change. For more detailed market data, including power, natural gas index prices, as well as forwards and futures, visit our Commodities Pages.


Working Gas in Underground Storage, Lower 48   Year Ago (05/04/17)   5-Year (2013-17) Average  
  May-04-2018 Apr-27-2018 net change (Bcf) implied flow (Bcf)   stocks (Bcf) % change stocks (Bcf) % change
East 243 223 20 20   346 -29.8 347 -30.0
Midwest 240 221 19 19   523 -54.1 398 -39.7
Mountain 92 86 6 6   155 -40.6 127 -27.6
Pacific 195 187 8 8   237 -17.7 246 -20.7
South Central 662 626 36 36   1033 -35.9 832 -20.4
  Salt 204 190 14 14   331 -38.4 252 -19.0
  Nonsalt 458 436 22 22   701 -34.7 580 -21.0
Total 1432 1343 89 89   2295 -37.6 1952 -26.6
             

Storage Report Summary:
Working gas in storage was 1,432 Bcf as of Friday, May 4, 2018, according to EIA estimates.

This represents a net increase of 89 Bcf from the previous week. Stocks were 863 Bcf less than last year at this time and

520 Bcf below the five-year average of 1,952 Bcf. At 1,432 Bcf, total working gas is within the five-year historical range


05/02/2018: June Gas Pressured by Bearish Fundamentals Overnight

May 2nd, 2018

After ending the prior session with a 3.9-cent gain at $2.802/MMBtu, NYMEX June natural gas futures lost footing overnight ahead of the Wednesday, May 2, open, amid overriding fundamental weakness. At 10:45 a.m. ET the contract was 4 cents lower at $2.76/MMBtu.
Natural gas inventories are expected to begin rebuilding after a prolonged withdrawal season that continued throughout much of April, which is typically considered the first month of injection season. Storage levels have drawn lower by 73 Bcf thus far in April, leaving total working gas stocks at 1,281 Bcf, or 897 Bcf below the year-ago level and 527 Bcf below the five-year average of 1,808 Bcf as of the week ended April 20.
For the next storage report week ended April 27 that is due out from the U.S. Energy Information Administration at 10:30 a.m. ET on Thursday, May 3, preliminary estimates call for builds spanning the upper 40s Bcf to the upper 50s Bcf. That would compare with a 68-Bcf prior-year injection and a 69-Bcf five-year-average addition.
Anticipated weather and production levels feed support for a healthy pace of inventory rebuilding going forward.
The National Weather Service sees above-average temperatures gripping a majority of the country through both the six- to 10-day and eight- to 14-day periods. Average temperatures scattered over parts of the eastern U.S. and Gulf Coast in the shorter-range view shrink in scope in the extended period to be contained to a few areas of the east-north-central U.S. and the southern tip of Texas, as below-average temperatures initially confined to Michigan and southern Texas eventually disappear from the outlook.
Predominantly warmer weather should erase demand for heating, while a ramp-up in cooling demand should be met by ample supply as rig count data supports outlooks for an increase in natural gas production.
Analysts with the American Gas Association said builds through the injection season should drive inventories to between 3.5 Tcf and 4.0 Tcf by the end of October.