The U.S. Energy Information Administration reported a net 89-Bcf injection into natural gas inventories in the Lower 48 during the week ended May 4 that was at par with consensus and above averages.
The injection matched consensus ahead of the report’s release that called for a 89-Bcf build to stocks, and compared above respective year-ago and five-year average injections of 49 Bcf and 75 Bcf, respectively.
The injection brought total U.S. working gas supply to 1,432 Bcf, or 863 Bcf below the year-ago level and 520 Bcf below the five-year average storage level of 1,952 Bcf.
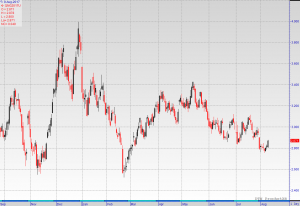
June natural gas futures were trading higher ahead of the data’s 10:30 a.m. ET release eyed 2.2 cents higher at $2.759/MMBtu at 10:29 a.m. ET. Following the release, the contract extended past the pre-release high of $2.772/MMBtu to a fresh high at $2.792/MMBtu and traded last 4.9 cents higher at $2.786/MMBtu.
In the East, inventories were up 20 Bcf on the week at 243 Bcf, or 29.8% below the year-ago level. Storage levels in the Midwest were up 19 Bcf at 240 Bcf, or 54.1% below the year-ago level. In the Mountain region, storage levels were up 6 Bcf on the week at 92 Bcf, or 40.6% below the year-ago level, while in the Pacific region, storage levels were up 8 Bcf on the week at 195 Bcf, or 17.7% below the year-ago level. In the South Central region, where storage levels were up 36 Bcf, stocks are at a deficit of 35.9% to a year earlier.
Working gas stocks in the South Central region totaled 662 Bcf, with 204 Bcf in salt cavern facilities and with 458 Bcf in non-salt cavern facilities. Working gas stocks were up 14 Bcf in salt cavern facilities and up 22 Bcf in non-salt cavern facilities since the previous week.
Market prices and included industry data are current as of the time of publication and are subject to change. For more detailed market data, including power, natural gas index prices, as well as forwards and futures, visit our Commodities Pages.
| Working Gas in Underground Storage, Lower 48 | Year Ago (05/04/17) | 5-Year (2013-17) Average | |||||||
| May-04-2018 | Apr-27-2018 | net change (Bcf) | implied flow (Bcf) | stocks (Bcf) | % change | stocks (Bcf) | % change | ||
| East | 243 | 223 | 20 | 20 | 346 | -29.8 | 347 | -30.0 | |
| Midwest | 240 | 221 | 19 | 19 | 523 | -54.1 | 398 | -39.7 | |
| Mountain | 92 | 86 | 6 | 6 | 155 | -40.6 | 127 | -27.6 | |
| Pacific | 195 | 187 | 8 | 8 | 237 | -17.7 | 246 | -20.7 | |
| South Central | 662 | 626 | 36 | 36 | 1033 | -35.9 | 832 | -20.4 | |
| Salt | 204 | 190 | 14 | 14 | 331 | -38.4 | 252 | -19.0 | |
| Nonsalt | 458 | 436 | 22 | 22 | 701 | -34.7 | 580 | -21.0 | |
| Total | 1432 | 1343 | 89 | 89 | 2295 | -37.6 | 1952 | -26.6 | |
Storage Report Summary:
Working gas in storage was 1,432 Bcf as of Friday, May 4, 2018, according to EIA estimates.
This represents a net increase of 89 Bcf from the previous week. Stocks were 863 Bcf less than last year at this time and
520 Bcf below the five-year average of 1,952 Bcf. At 1,432 Bcf, total working gas is within the five-year historical range


