News & Events

Retail Supplier to Provide Millions in Goodwill Credits

March 6th, 2014

IDT Energy announced that it is providing customers with millions of dollars in goodwill credits and rebates, as a result of the polar vortex pricing.

IDT Energy said that it has not determined a final amount of credits it will ultimately provide to customers, but estimated that it has issued approximately $2 million in credits based on requests and rebates issued thus far.

Most requests are from Pennsylvania customers.

IDT Energy said that, “[t]he range of individual rebates varies, since every customer’s bill and rate charged is unique based on the customer’s specific billing/rate cycle.  We are doing everything we can to fairly address concerns from customers who received bills that were impacted by the cost spikes driven by the colder temperatures and are helping customers with meaningful credits that will get them closer to a rate they saw in their prior month’s (before the cold weather event) IDT Energy supply rate.”

Copyright 2010-13 EnergyChoiceMatters.com
Reporting by Karen Abbott • kabbott@energychoicematters.com


The Polar Vortex and Natural Gas Prices

February 28th, 2014

If you keep tabs on natural gas and electricity prices, then you’ve probably been shocked by the market’s volatility and strength this winter.

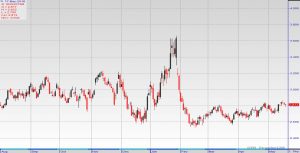
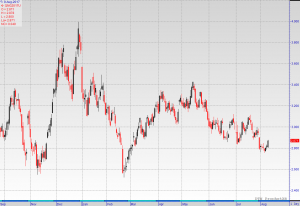
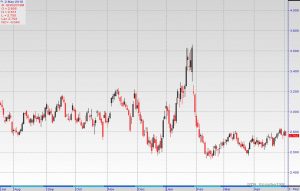
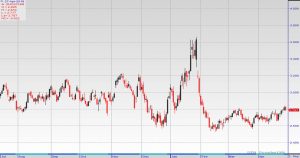
NYMEX natural gas futures reached 5-year highs. Spot gas prices posted new all-time highs at more than $50 per MMBtu in parts of the Northeast US. And spot power prices were sustained above $100 for days and even weeks from parts of the Midwest all the way up to New England. We can place most of the blame on the Polar Vortex and its impact on natural gas and power demand, as well as on natural gas storage inventories. But when will it end?

Will prices fall when the weather warms? Yes, no, and maybe so. My apologies for the vague response, but give me a chance to explain.

YES: Spot prices fall as demand falls and temperatures rise, but not without risk and volatility, of course. But day-to-day and hour-to-hour prices should be lower in the spring compared to the peaks of January.

Also, if you watch the NYMEX for the prompt month (the nearest month that is traded), it should fall, because the nearest month will change from a winter month (March) to a spring month (April).

NO: But from the perspective of an end-user who shops for gas or power every six,12, or 18 months, then none of that really matters. What really matters is the price for the remainder of 2014 or for 2015 and beyond. How will a price for those terms change as winter ends? There is a very different answer to this question.

Unfortunately, the Polar Vortex’s impact on the market will be sustained through 2014 and will provide resistance to price declines.

  1. Natural gas storage. Record gas demand has resulted in record withdrawals of natural gas from storage, resulting in a huge storage deficit compared to historical levels (40% below last year at this time of year and 33% below the 5-year average). To prepare for next winter, more gas must be injected from April to October to refill storage to historical levels, thereby eliminating the storage deficit.How much more natural gas needs to be injected? More than 3.5 Bcf per day above the typical pace. Where will this additional supply come from? Possibly from shale gas, but this could absorb all shale growth, which was a key driver of previously low prices. But higher prices than 2012 and 2013 could provide an extra incentive for producers to bring more supply to market. Similarly, high prices can discourage demand such as some gas generation that may be replaced by cheaper coal. But in each case, prices higher than a year ago may be needed. April – October NYMEX is currently trading near $4.50 compared to finishing at $3.78 during 2013.

    Risk. This year’s unforeseen market strength and volatility will also change the assessment of future risk by market participants in a way that may sustain higher prices. This premium may be narrowly focused on certain regions (especially the Northeast) and seasons (winter). Consecutive winter price spikes in Massachusetts will likely support prices for next winter in that region. And this same risk from a New England winter can translate to an ERCOT summer. Even if the NYMEX would fall, there may be terms and locations that resist such a decline and maintain a risk premium that reflects the new perceived market upside from this winter.

MAYBE: This doesn’t mean that prices can’t fall. Weather could be mild. Producer output could exceed supply expectations. But the end of winter itself will not erase the impact of the Polar Vortex on prices for the remainder of 2014.

What about 2015 and beyond? Long-term prices have moved only modestly during this winter. Why? Storage is expected to normalize over time, so the current deficit has limited impact on long-term prices. But since near-term fundamentals did not push long-term prices higher, then another change in near-term fundamentals as winter ends should not cause a decline either.

REMEMBER: Current market prices reflect information currently available. We all know that winter will end, and will not be the only driver to change prices beyond the near-term. Putting near-term price volatility aside, which can be very unpredictable and sometimes unexplained, it will take new information to push prices lower. But new information could just as easily push prices higher. Prices bottomed in April 2012, but rose through April 2013.

Make sure you’re being realistic with any buying strategies for 2014 that considers potential market support due to the storage deficit. And don’t assume that high near-term prices prevent consideration of long-term prices, which may present a discount and a value for 2015 and beyond!

And keep your focus beyond tomorrow to avoid exposure to the next market surprise.

Source : http://www.tepausa.org/public-tepa-announcement/polar-vortex-natural-gas-prices/

Oil net imports have declined since 2011, with their value falling slower than volume

February 25th, 2014

Source: U.S. Census Bureau: Foreign Trade Division

The drop in net imports of oil (crude and petroleum products combined) was the major contributor to the United States reaching its lowest net trade deficit in November 2013 since 2009, although the trade deficit increased in the final month of 2013. U.S. oil trade, by far the dominant component of overall U.S. energy trade, has seen major changes in recent years. In both absolute and percentage terms, U.S. net import dependence measured volumetrically (in terms of barrels or barrels per day) has been declining since 2005.

Although the volume of net oil imports peaked in 2005, the value of monthly net oil imports generally continued to rise through July 2008, when it exceeded $40 billion due to the sharp run-up in oil prices through the first half of that year. Net import values fell sharply in the second half of 2008, as volumes fell modestly and prices fell sharply. From early 2009 through early 2011, rising prices drove the value of net oil imports higher, even as import volumes remained flat. Since early 2011, a falling volume of crude oil imports as domestic production has risen sharply and the emergence of net product exports have driven the volume and value of net oil imports lower. These reductions occurred even though the annual average oil prices in 2012 and 2013 were at their highest historical levels.

While the United States has historically been a significant net importer of both crude oil and petroleum products, stagnating domestic product demand combined with very competitive refinery infrastructure and strong global product demand turned the United States into a significant net exporter of petroleum products starting in 2011.


By value, crude oil imports were down 16% year-over-year in 2013. EIA’s February Short-Term Energy Outlook forecasts continued rapid growth in domestic crude oil production in both 2014 and 2015, which should further reduce the volume of net crude oil imports over this period. Given the continued flatness in domestic demand and continued access of U.S. refiners to domestic crude streams and relatively low-cost natural gas to fuel their refineries, the country is likely to maintain its current role as a major net exporter of distillate fuels and other products to external markets, especially those in the Atlantic Basin. The upper limits to near-term product export growth are likely to be defined by refinery capacity, while the lower limits to product exports likely depend on potential weakness in foreign product demand, perhaps responding to weaker-than-expected economic conditions.

Source: U.S. Energy Information Administration Monthly Energy Review, Short-Term Energy Outlook February issue, and Petroleum Navigator Note: Data for 2013-15 are from the Short-Term Energy Outlook February issue.


Domestic production of crude oil, including lease condensate, is projected to increase sharply in the AEO2014 Reference case, with annual growth averaging 0.8 million barrels per day through 2016, before leveling off and declining slowly after 2020. Net imports are also reduced by the continuing decline in U.S. oil use as fuel economy standards for cars and light trucks become steadily more stringent through 2025. The combination of higher oil production and lower oil consumption in the United States has already reduced net imports as a share of U.S. liquid fuels use from 60% in 2005 to 40% in 2012, with a further decline of the net import share to 27% in 2015 and 26% in 2020 projected in the AEO2014 Reference case. Net import volumes of crude oil and liquid fuels on a volume basis are projected to decline by 55% between 2012 and 2020.

Principal contributors: Robert McManmon, Michael Ford

Wholesale Price Update

February 24th, 2014

NYMEX prompt month has decreased by 7.80 cents. The 12 month contract has increased by 10.63 cents at $5.001/dth

The 6 to 10 day forecast expects the Northeast and Midwest to be significantly below normal, Texas to be below normal and California to be above normal. The 10 to 14 day forecast follows the same trend.

Fuzzy Math: Texas Capacity Market Supporters Know What Future Energy Market Prices Will Be to Make Claim on Cost of Capacity Market; Except They Don’t Know What Future Energy Market Prices Will Be, Which is Why They Need a Capacity Market

February 21st, 2014

There’s a lot of absurdities when trying to wade through the inconsistent and illogical arguments in favor of a Texas centralized capacity market, but the latest line being pitched by capacity market supporters may be our favorite.

Recognizing the infirmity of basically asking Texans to pay $3-4 billion as an additional line item on bills for capacity, Texas capacity market supporters not only claim that the capacity market won’t raise prices by all that much, but, with the Brattle economically-optimal reserve margin report, now claim authoritative proof that costs under an energy-plus-capacity market will be “roughly” the same as the energy-only market.

“The false narrative concerning the cost of a capacity market was shattered in one report,” according to a statement from Eric Bearse, spokesman for capacity market advocate Texans for Reliable Power, which appears on the group’s website. “For roughly the same cost in normal years, and for less cost in extreme weather years, we can ensure the reliability of the grid through the competitive market mechanisms of a capacity market. It will cost a tenth of a cent per kilowatt hour to ensure our electric grid has world class reliability beyond the next few years.”

Elsewhere, capacity market supporters claim, based on the Brattle study, that a capacity market would only cost $400 million, on a net basis, when taking into account future energy market price reductions stemming from having a set amount of installed capacity on the grid

Putting aside any quibbles with Brattle’s methodology and inputs used to reach its cost conclusion, and accepting the calculations as stated, you still have to ask one fundamental question.

If capacity market supporters are so sure that the costs of a capacity market will be roughly the same as an energy market, then why is a capacity market even needed?  Under their own logic, the aggregate revenues to capacity owners must be the same — if the capacity market is not going to appreciably increase costs to Texas customers, it logically follows that it will not increase compensation to capacity owners.  If that’s the case, why is this market even needed?

We’d expect that the capacity market supporters would say that the capacity market gives certainty to those revenues, and we don’t disagree.  But implicit in that certainty argument is that energy market revenues are uncertain.  Meaning future energy market prices cannot be known with any reasonable confidence in the future; meaning any evaluation premised on a comparison of future energy prices versus future energy-plus-capacity prices amounts to fantasy.

Indeed, the uncertainty of energy prices has been the refrain for years now from capacity market supporters.  Even if, with high price caps, there should be no missing money, per se, in the energy market when scarcity conditions are appropriately reflected in prices, the generators claim that this sound market design is irrelevant, because they cannot invest based on uncertain and unpredictable energy prices, and generators proclaim that there is no guarantee that prices will reach scarcity levels.

Now, however, we are suddenly invited to believe that energy prices are not only predictable, but that, on a total cost basis, the energy-only costs will be about the same as the energy-plus-capacity costs.  This argument is premised on routine scarcity pricing at the new higher prices caps — a scenario capacity market supporters have repeatedly said isn’t reliable, but now take as gospel.

If generators are so sure of the higher costs of the energy-only market, what’s the hold up to investment?  If they are so confident that compensation under the energy-only market will cost the same to customers as under a capacity market, why aren’t they investing?

The answer is clear.  Capacity owners know that maintaining an energy-only market will be a vastly less costly solution than mandating a $4 billion capacity line-item tax on Texas ratepayers, and then hoping three years in the future, there’s enough available capacity on the grid to prevent scarcity pricing and avoid both high energy prices and capacity prices.

One need only look to the recent experience in PJM to show that having an installed capacity base in excess of the reserve margin doesn’t provide any meaningful insurance against energy market volatility or scarcity pricing — witness 40% of PJM capacity being offline during the recent January extreme cold weather, and the attendant price spikes which forced retail suppliers to default, and which led to retail rates approaching (if not exceeding) 30 cents per kilowatt-hour.

It’s clear that capacity prices are divorced from real-time energy prices, which is not surprising, since capacity resources are in no way procured in a manner to optimize least-cost dispatch.  Indeed, by virtue of the narrow focus on going-forward fixed costs, the capacity market often results in just the opposite — an old, inefficient collection of resources that are able to clear a government-defined hurdle to have access to the energy market (and then aren’t penalized when suffering the inevitable forced outages from running a 50+ year old unit).

Fantasies that carrying a government-determined level of installed capacity is suddenly going to calm energy market pricing and avoid scarcity conditions should therefore be put to rest.  As seen in PJM, energy market prices are just as likely to reach scarcity levels in an environment with mandatory capacity purchases at an installed reserve margin; therefore, unless generators are willing to put their money where their mouth is regarding the cost of a capacity market, and accept dollar-for-dollar clawbacks for costs exceeding their forecast calm energy market revenues, arguments that a capacity market will result in lower energy market prices for Texans should be ignored as wishful thinking.

Copyright 2010-13 EnergyChoiceMatters.com
Reporting by Paul Ring • ring@energychoicematters.com

PUC: Wholesale Increases Causing Some Electricity Rates To Rise Significantly

February 19th, 2014

PHILADELPHIA (CBS) – The Public Utility Commission is again reminding consumers with alternative electric suppliers to check their contracts because increases in the wholesale market price for energy are causing some rates to double and triple.

At the end of January, the PUC issued a warning about increases on the wholesale market.

Spokeswoman Jennifer Kocher says since then, “in just one week, we received 175 complaints from customers   expressing concern over their electric bills, and saw their kilowatt-hour price increase, in some cases two and three times.”  Full Article http://cbsloc.al/1e7sgnZ


Natural-Gas Futures Soar to 4-Year High

February 19th, 2014

Natural-gas futures soared more than 7% to a four-year high Wednesday on forecasts for another cold blast in the next two weeks.

Traders anticipate more U.S. heating-related demand just as natural-gas supplies have already been depleted by the severe winter.

Gas for March delivery rallied 37.1 cents, or 6.7%, to $5.9220 a million British thermal units Wednesday on the New York Mercantile Exchange. Prices are at their highest level since Jan. 25, 2010.

Just a week ago, weather forecasters were predicting a warming trend through the end of the month. But predictions began changing over the weekend, with a new cold front appearing next week and another “Polar Vortex”-style blast expected over much of the U.S. in early March.

The new forecasts call for “fierce and frigid” cold across the Midwest, the East Coast and even the Deep South, with two days of subzero temperatures in Chicago during the period, according to Commodity Weather Group. And the cold will last longer into the extended forecast than previously expected. Full Article http://on.wsj.com/1d01pKU

Another Utility Holding Company Puts Retail Electric Supplier Up For Sale

February 19th, 2014

Duke Energy confirmed to EnergyChoiceMatters.com that the recently announced sale process for its Midwest commercial generation business includes competitive retail electric supplier, Duke Energy Retail.

Specifically, Duke Energy provided the following statement to EnergyChoiceMatters.com: “Currently, Duke Energy Retail is included in the sales process along with our Midwest generation assets. At the same time, we’ll have more clarity once a buyer has been identified and the scope and terms of the transaction are in place.”

Although the inclusion of Duke Energy Retail was expected, given that its primary purpose was to market or hedge generation from the Midwest assets, in announcing the Midwest generation exit, Duke had not explicitly said that the competitive retail supplier was included in the sale or that it otherwise was going to pursue an exit from the competitive retail electric business.

Copyright 2010-13 EnergyChoiceMatters.com
Reporting by Karen Abbott • kabbott@energychoicematters.com

Oil dips; natural gas soars on supply report

February 14th, 2014

The price of oil barely budged Thursday. But natural gas futures soared and U.S. drivers again saw higher numbers at the gas pump.

Benchmark U.S. crude for March delivery slipped 2 cents to $100.37 a barrel on the New York Mercantile Exchange. U.S. economic indicators were mostly downbeat on Thursday, suggesting weak demand. A report from the International Energy Agency gave oil some support. The agency raised slightly its 2014 forecast for global demand to 92.6 million barrels a day, 125,000 barrels a day above its previous expectations from a month ago.

Natural gas futures jumped 40 cents, or 8 percent, to $5.22 per 1,000 cubic feet. The Energy Department said supplies fell by 237 billion cubic feet last week, more than the 230 billion cubic feet decline predicted by analysts.

Meanwhile, U.S. drivers are paying 6 cents more per gallon on average than a week ago. The nationwide average climbed 1 penny Thursday to $3.33 a gallon. In Houston Thursday, the average was $3.125 a gallon, up from $3.102 Wednesday, according to AAA.

Brent crude, which is used to set prices for international varieties of crude, fell 6 cents to $108.73 on the ICE Futures exchange in London.

In other energy futures trading in New York: — Wholesale gasoline rose 1 cent to $2.78 per gallon. — Heating oil added 2 cents to $3.03 a gallon.


Posted  by Associated Press in Crude oil, Gasoline, Markets, Natural gas

The Department of Energy Announced That the Cost of Power from Solar Panels is Now Cheaper than Grid Electricity

February 13th, 2014

The Obama administration says that SunShot, the R&D program to bring down the cost of solar-generated electricity to where it’s competitive with conventionally sourced electricity, is 60 percent of the way toward its goal, at least when it comes to big solar.

Citing levelized cost of energy data from the National Renewable Energy Lab, the Department of Energy said on Wednesday that “the average price for a utility-scale PV project has dropped from about $0.21 per kilowatt-hour in 2010 to $0.11 per kilowatt-hour at the end of 2013.”

sunshot cost

Image via U.S. DOE, based on National Renewable Energy Lab data.

The DOE noted that the average retail price of electricity in the U.S. is 12 cents per kWh. That said, utility-scale solar electricity doesn’t really compete with retail electricity (whereas distributed, or rooftop solar, does) – which is why SunShot has a 2020 goal of getting solar down to 6 cents per kWh, in the neighborhood of the cost of new natural gas-fired generation.

The administration didn’t point to specific SunShot investments that have impacted the cost of utility-scale solar, but the program has supported a wide range of research and development efforts, typically with six- or seven-figure awards, occasionally larger. Many of the funding opportunities have been applicable to distributed solar, but an example of a SunShot program aimed at utilty-scale would be the $25 million grant to Soitec to open a plant in San Diego. The company makes concentrating photovoltaics panels that are used in utility-scale plants in sunny areas like the U.S. Southwest.

In any case, however much SunShot has had to do with the drop in the cost of big solar, surely a much bigger factor has been the precipitous and fortuitous (well, maybe not for Solyndra) decline in the price of solar PV, so steep that power plants that had been envisioned using solar thermal have switched to PV. The factors there have been a host of market forces – demand slipping from high growth rates, polysilicon plunging in price, the over-extended Chinese manufacturing sector dumping cheap panels all over the world, etc. The administration’s loan guarantee program has probably helped utility-scale solar, as well, by getting several big plants launched and showing their viability, and the administration can also take credit for aggressively permitting large amounts of big solar on public lands.

As for how much money has gone into SunShot, with Washington, D.C., emptying out on Wednesday in advance of a forecast snowstorm, we were unable to track down a firm number. However, the Energy Department had said it was looking to spend $356.5 million on SunShot in the 2014 fiscal year.

Source:

http://www.earthtechling.com/2014/02/doe-sunshot-hitting-mark-with-solar-price-plunge/