The U.S. Energy Information Administration reported Thursday that domestic supplies of natural gas rose by 86 billion cubic feet for the week ended Sept. 14.
Analysts polled by S&P Global Platts had forecast a climb of 83 billion cubic feet, while the average over the last five years for the same week was a rise of 76 billion.
Total stocks now stand at 2.722 trillion cubic feet, down 672 billion cubic feet from a year ago, and 586 billion below the five-year average, the government said.
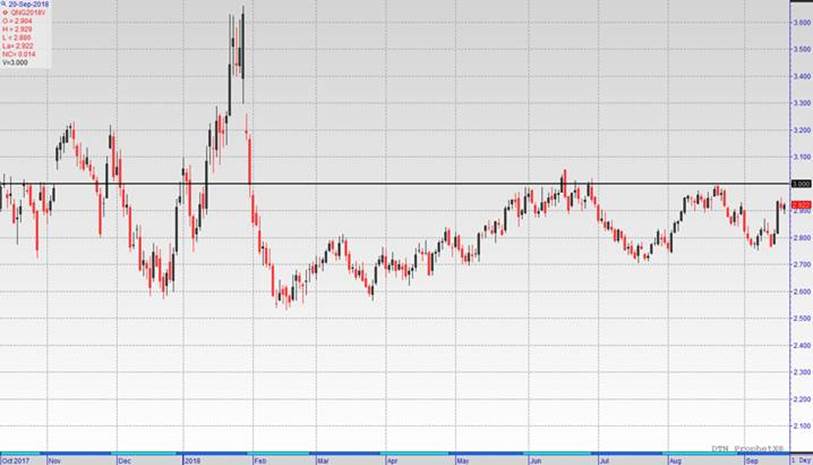
October natural gas NGV18, +0.24% traded at $2.913 per million British thermal units, up half a cent from Wednesday’s settlement.
It was trading at $2.90 before the supply data.
| Working Gas in Underground Storage, Lower 48 | Year Ago (09/14/17) | 5-Year (2013-17) Average | |||||||
| Sep-14-2018 | Sep-07-2018 | net change (Bcf) | implied flow (Bcf) | stocks (Bcf) | % change | stocks (Bcf) | % change | ||
| East | 709 | 679 | 30 | 30 | 830 | -14.6 | 801 | -11.5 | |
| Midwest | 770 | 734 | 36 | 36 | 933 | -17.5 | 910 | -15.4 | |
| Mountain | 170 | 166 | 4 | 4 | 211 | -19.4 | 199 | -14.6 | |
| Pacific | 255 | 250 | 5 | 5 | 299 | -14.7 | 328 | -22.3 | |
| South Central | 818 | 806 | 12 | 12 | 1120 | -27.0 | 1071 | -23.6 | |
| Salt | 184 | 182 | 2 | 2 | 301 | -38.9 | 274 | -32.8 | |
| Nonsalt | 635 | 624 | 11 | 11 | 819 | -22.5 | 797 | -20.3 | |
| Total | 2722 | 2636 | 86 | 86 | 3394 | -19.8 | 3308 | -17.7 | |
Storage Report Summary:
Working gas in storage was 2,722 Bcf as of Friday, September 14, 2018,
according to EIA estimates.
This represents a net increase of 86 Bcf from the previous week. Stocks were 672 Bcf less than last year at this time and 586 Bcf below the five-year average of 3,308 Bcf.
At 2,722 Bcf, total working gas is below the five-year historical range.


